Spending money on better product images is easy. Proving that money came back is the part most online sellers skip. They reshoot a listing, sales tick up a little, and they call it a win — without ever isolating whether the new photos did the work or whether a price change, a seasonal bump, or a fresh batch of ad traffic deserved the credit. That guesswork is exactly why photography budgets get cut first when margins tighten: nobody can point to the number that justifies them.
This guide is about that number. Not how to light a packshot or which aperture to use — that ground is already covered in our complete guide to product photography for ecommerce. Here we focus entirely on measurement: which metrics actually reflect image quality, how to run a clean image A/B test, how to attribute revenue to your visuals, and how to run the simple payback math that turns "the photos look nicer" into "this shoot returned 3.4x its cost." If you can measure it, you can defend it, and you can scale it.
Why Measure Photography ROI at All
Product images are not decoration; they are the substitute for physically handling an item. Research from the Baymard Institute found that exploring the product images is the first action 56% of shoppers take on a product page — before the title, the price, or the description. That makes imagery one of the few levers that touches the very top of the on-page funnel. When a lever sits that early in the path to purchase, small quality improvements can ripple through every downstream metric.
But "can" is not "did." The reason to measure is that photography competes for budget against ads, inventory, and tooling, all of which arrive with dashboards attached. Paid media reports cost-per-acquisition to the cent. If your imagery investment shows up as a vague sense that the catalog "looks more professional," it will always lose that budget fight. Measurement reframes photography from a one-time creative expense into a repeatable, comparable investment with a payback period you can rank against everything else you might spend on.
There is a second, subtler reason. Measurement tells you which images to upgrade. Most catalogs have a long tail of SKUs where better photos would barely move the needle, and a handful of high-traffic, low-conversion listings where a reshoot pays for itself in weeks. Without data you spread your budget evenly; with it, you aim.
The Metrics That Actually Reflect Image Quality
Revenue is the destination, but revenue alone is too noisy to tell you whether your photos are working. You need the mid-funnel signals that imagery directly influences. Track these per product, not just store-wide, so you can isolate the effect of a specific reshoot.
- Conversion rate (per SKU). The headline metric. Measure sessions-to-purchase on the same listing before and after an image change, holding price and traffic source constant. A genuine image win shows up here first.
- Add-to-cart rate. The cleanest mid-funnel read on whether your visuals are reducing purchase hesitation. Images move shoppers from "interested" to "I'll take it," and add-to-cart captures that moment before checkout friction muddies the data.
- Product-page bounce / exit rate. A high exit rate on a high-traffic PDP often means the imagery failed to answer the shopper's first questions. Watch whether better photos keep people on the page long enough to evaluate.
- Time on listing and image interaction. Zooms, swipes through the gallery, and dwell time signal that shoppers are finding useful visual information rather than scrolling away. These are leading indicators that move before conversion does.
- Return rate (and the reason codes). The most underrated photography metric. Misleading images generate returns; accurate ones prevent them. Tag returns where the buyer says the item "looked different" and watch that segment specifically.
The discipline that makes these useful is segmentation. A store-wide conversion number blends dozens of variables. A single-SKU conversion number, compared against itself across a controlled window, is something you can actually attribute to the photos.
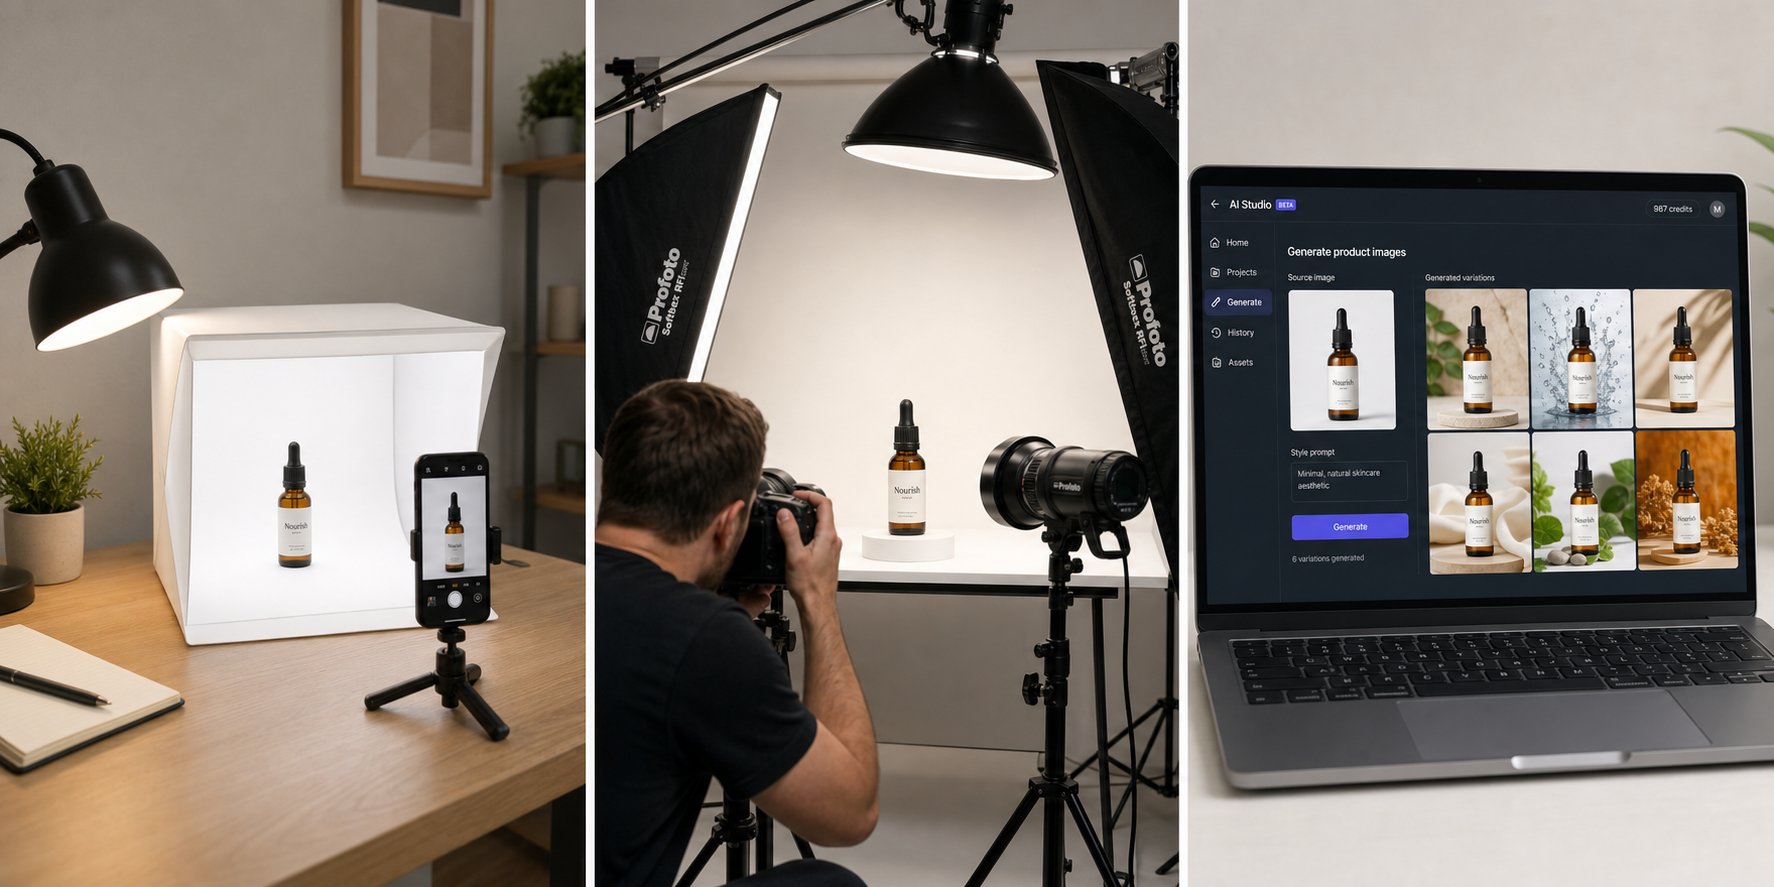
Want to test better images without a studio booking? Generate marketplace-ready variants from one source photo. Try Snappyit free →
Set a Clean Baseline Before You Change Anything
You cannot measure lift without a "before." The single most common reason photography ROI claims fall apart under scrutiny is that there was never a stable baseline to compare against. Build one deliberately.
Pick a measurement window long enough to smooth out daily noise — typically two to four weeks of normal trading, avoiding promotions, holidays, and major ad-spend swings. Record your baseline conversion rate, add-to-cart rate, and return rate for the specific SKUs you plan to upgrade. Note the traffic mix too: a listing that gets most of its visitors from branded search behaves very differently from one fed by cold paid traffic, and you want to compare like with like later.
Then change one thing. If you swap the hero image, the lighting style, and the title in the same week, any lift is unattributable. The whole point of a baseline is to create a controlled before-and-after, and that control evaporates the moment you bundle changes. Document what you changed and when, so three months from now you can still reconstruct exactly which version produced which number.
How to Run a Clean Product-Image A/B Test
A before-and-after comparison is a good start, but it is vulnerable to anything that changed between the two periods — a competitor's price drop, a seasonal shift, an algorithm update. A true A/B test runs both versions at the same time against split traffic, which removes those confounders. Where you run it depends on where you sell.
On Amazon: Manage Your Experiments
Brand Registry sellers can use Amazon's built-in Manage Your Experiments tool to A/B test the main image (along with the title, A+ Content, and product video) at no extra cost. Amazon splits traffic roughly 50/50 between the two versions, runs the test for a window you set — selectable in the four-to-ten-week range — and declares a winner when it reaches statistical significance. Because Amazon controls the traffic split natively, this is the cleanest image test most marketplace sellers will ever get to run. Eligibility requires a professional seller account enrolled in Brand Registry, A+ Content on the page, and an existing title and image.
On Shopify and your own PDP
On your own storefront you control the page, so you can split traffic with a testing tool (Shopify-native A/B apps and conversion-testing platforms both work) that serves variant A to half your visitors and variant B to the other half, then reports conversion by variant. The principles are identical to Amazon's: one variable, simultaneous exposure, a fixed stopping rule decided in advance. If a third-party split tool isn't an option, a disciplined sequential test (the baseline method above) is the fallback — just be honest that it carries more confounding risk.
What to actually test
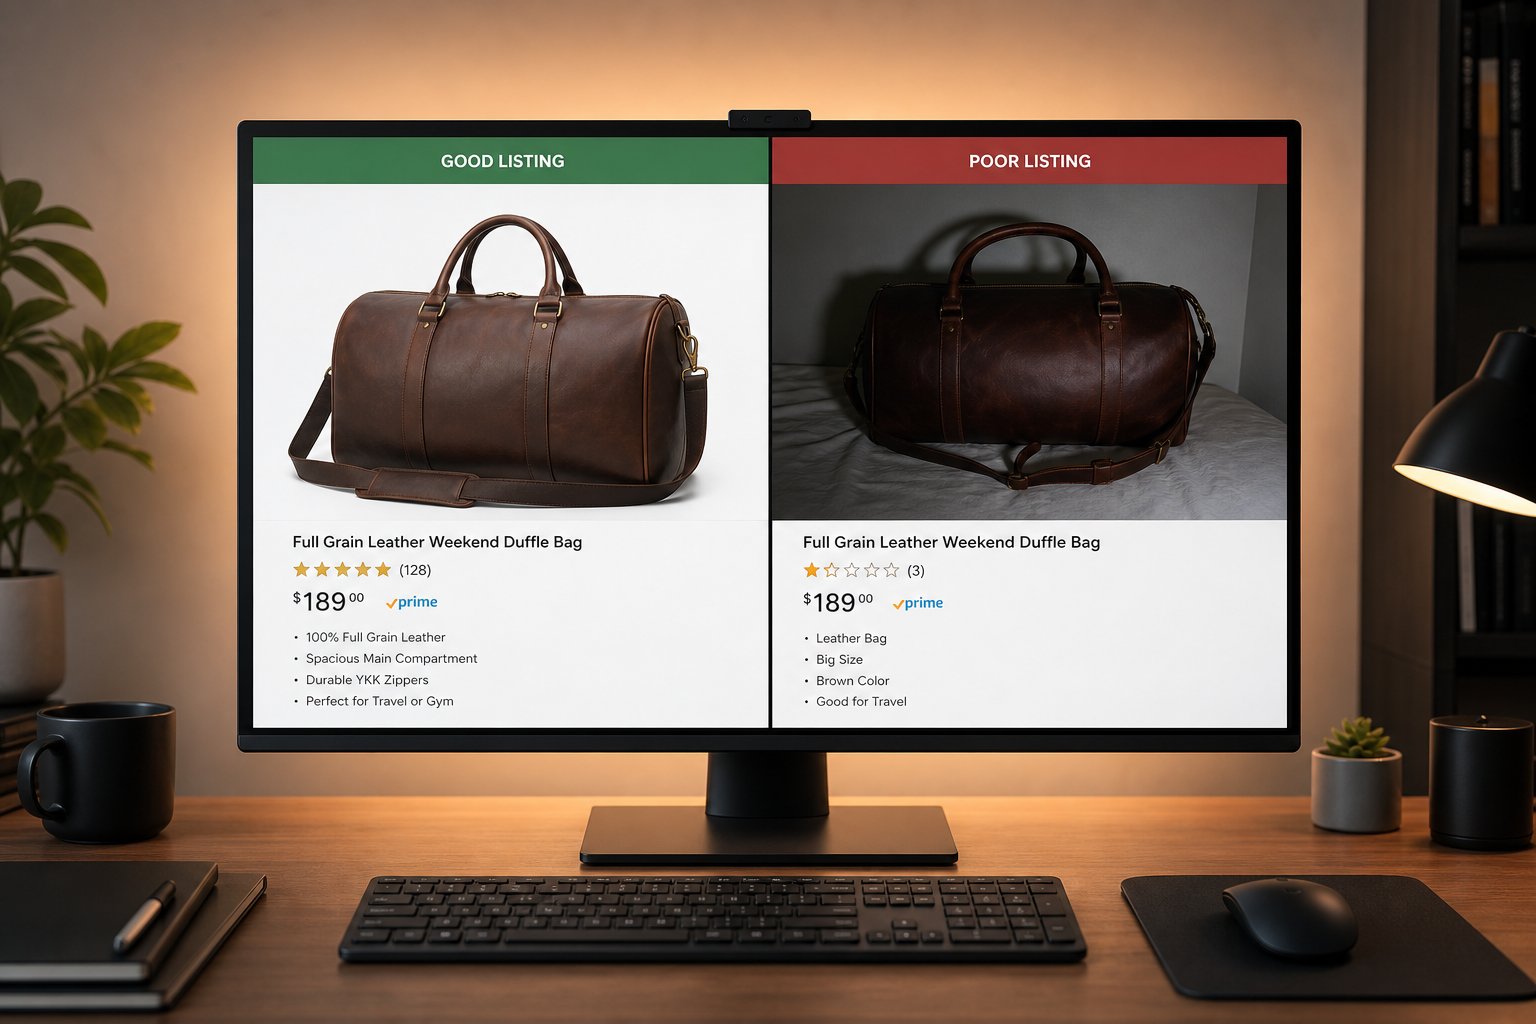
Start with the highest-leverage element: the hero/main image, since that is what shoppers see in search grids and category pages before they ever reach the listing. From there, test the type of secondary imagery — a lifestyle scene versus a plain packshot, an in-scale reference shot, a different gallery order. Each test should answer one question. "Does a lifestyle hero beat a white-background hero for this SKU?" is a test. "Are our new photos better?" is not.
Sample Size, Significance, and When to Stop
The fastest way to fool yourself is to call a test after a good morning. Conversion data is lumpy, and small samples swing wildly. Two rules keep you honest.
Decide your stopping rule before you start. Either run for a fixed window (Amazon's four-to-ten weeks is a sensible default) or run until you hit a pre-set significance threshold — Amazon's tool uses 95% confidence before naming a winner, which is the conventional bar. What you must not do is peek daily and stop the instant the variant is ahead; that "optional stopping" inflates false positives dramatically.
Make sure you have enough traffic to detect a realistic effect. Image changes typically produce single-digit-percent conversion swings, and detecting a small effect requires a lot of sessions. As a practical floor on your own PDP, aim for at least a few hundred conversions per variant, not just a few hundred sessions; low-traffic listings may simply never reach significance, in which case a longer run or a roll-up across similar SKUs is your only honest path. If a listing gets 50 visitors a week, an A/B test is the wrong tool — use a longer before-and-after window and treat the result as directional, not proven.
Test lifestyle and on-model scenes at scale. Spin up multiple variants per SKU in minutes. Try Snappyit free →
Attributing Revenue Lift to Your Images
Once a test produces a credible conversion delta, translate it into money — carefully. The trap is crediting imagery for revenue that other changes earned. Three habits keep attribution clean.
Hold everything else constant during the test. No price changes, no new ad campaigns pointed at the test SKU, no inventory-driven ranking shifts if you can help it. The only thing that should differ between variant A and variant B is the image.
Express lift as incremental units, then incremental margin. If a SKU converted at 2.0% on the old image and 2.4% on the new one across the same traffic, that is a 0.4-percentage-point absolute lift, or a 20% relative improvement. Multiply the incremental conversion rate by the listing's sessions and the product's contribution margin (not its sticker price) to get the dollars the new image actually added. Using margin instead of revenue is what keeps the ROI number honest.
Account for the durability of the asset. Unlike an ad, a good image keeps working with no recurring spend. A studio shoot or an AI-generated set is a one-time cost that earns lift on every future visitor for as long as the listing lives. When you compute payback, you can amortize the shoot cost across the months the image will realistically stay live — just resist the temptation to claim it "compounds forever," which overstates a flat, durable benefit.
Don't Forget Returns in the ROI Math
Conversion lift is only half the financial story. The other half — often the larger half for apparel and other fit-sensitive categories — is what accurate imagery does to your return rate. Returns are pure margin destruction: you pay outbound shipping, reverse logistics, restocking labor, and frequently can't resell the item at full price.
The scale is real. The NRF and Happy Returns 2024 report put total US retail returns at roughly $890 billion, an overall return rate of about 16.9% of sales, with online purchases returned at a higher rate than the overall average. And a meaningful share of those returns trace back to expectation gaps: in Salsify's 2025 consumer research, 71% of shoppers said they had returned a product because it didn't match its online description. Accurate color, true-to-life scale references, and multiple angles set expectations the unboxing can actually meet.
Here is the part to get right, because it is where ROI math usually goes wrong. Reducing a return rate from 20% to 15% on a store doing $500,000 in revenue does not save $50,000. A 20% rate is $100,000 of returns; a 15% rate is $75,000 — a $25,000 saving. To halve your return cost you'd have to cut the rate by ten full points, not five. Always work the arithmetic in absolute dollars of returned merchandise, then apply your reverse-logistics cost per return, rather than multiplying a percentage-point change by total revenue.
A Simple ROI Formula You Can Defend
Put the two effects together and the formula is straightforward. For a given SKU or shoot:
Photography ROI = (Incremental margin from conversion lift + Margin saved from fewer returns − Cost of the imagery) ÷ Cost of the imagery
Walk it through with round numbers. Say a reshoot of one listing costs $120. The listing gets 4,000 sessions a month, converts up from 2.0% to 2.4% after the new image (16 extra orders), and each order carries $18 of contribution margin — that's about $288 of incremental margin per month. If accurate photos also trim that SKU's return rate enough to save another $40 a month in reverse-logistics cost, the monthly benefit is roughly $328. The $120 shoot pays back in well under two weeks, and every month after is close to pure return for as long as the image stays live.
Two guardrails keep this number trustworthy. First, use margin, not revenue, on both the lift and the returns side — revenue-based ROI flatters every project. Second, only count incremental effects you measured against a baseline or a controlled test; do not retro-fit a lift you merely hope happened. A defensible ROI number is one you'd be comfortable showing the person who controls the budget.

What the Research Actually Shows (and What to Ignore)
The internet is full of confident-sounding photography statistics with no source behind them — "studies show better photos lift conversion 30–40%," "images drive 93% of buying decisions." Treat any unattributed percentage as marketing, not evidence. A handful of figures, however, come from credible research and are worth anchoring your expectations to.
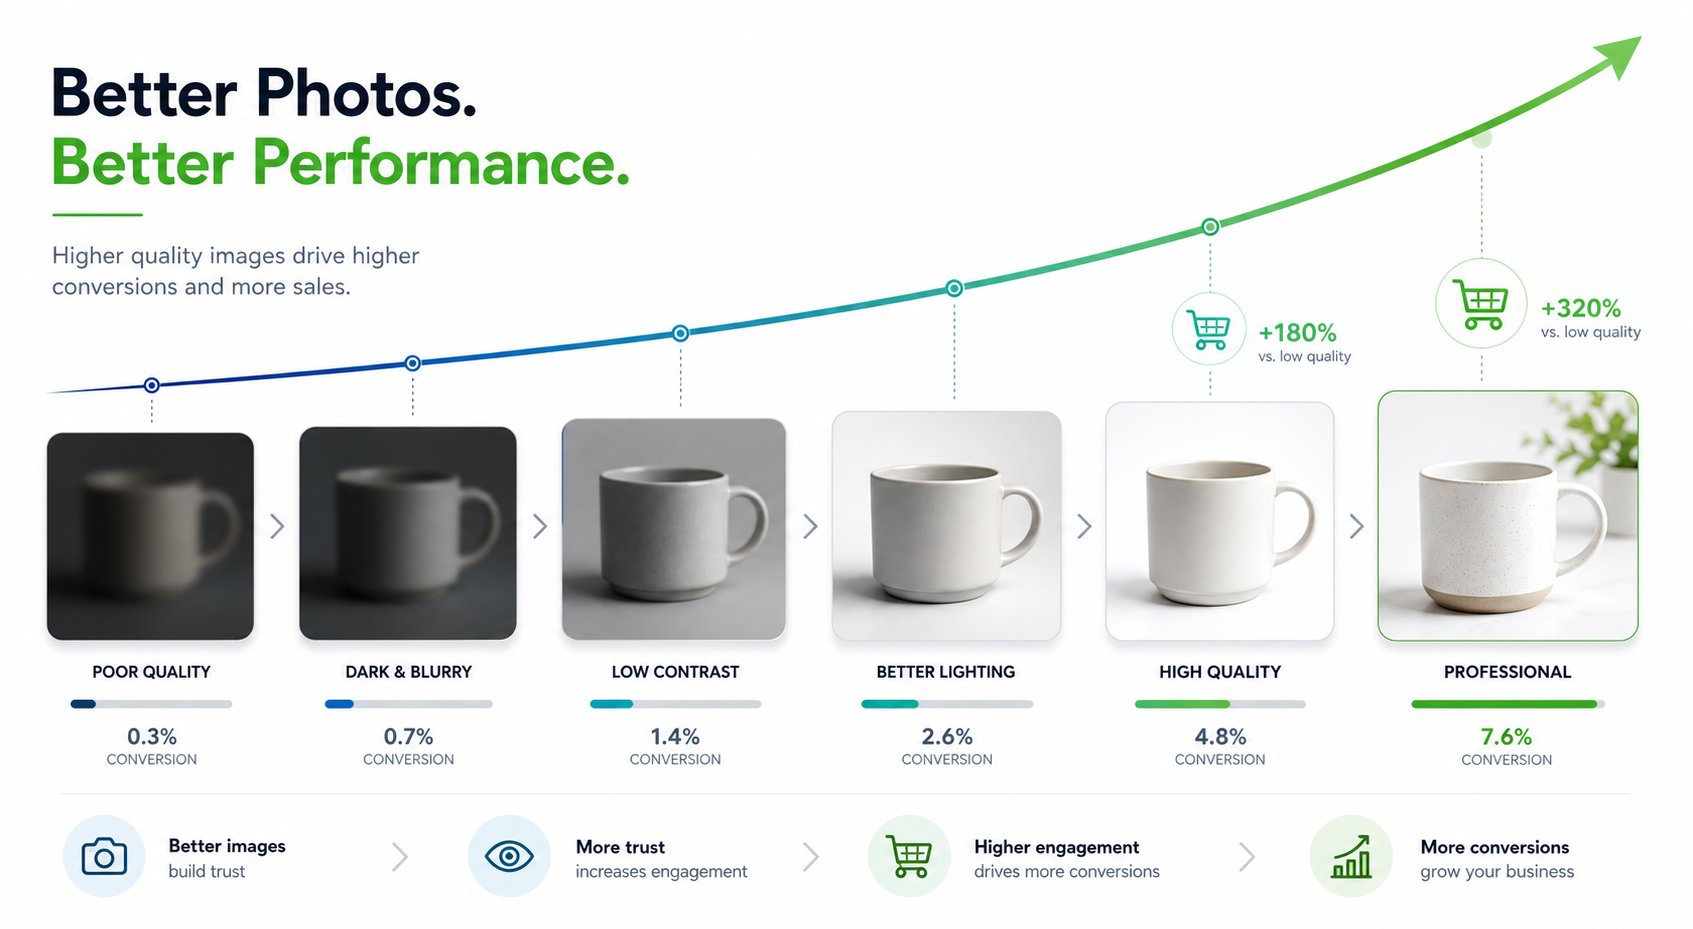
On marketplaces, a Cornell Tech study analyzed roughly 75,000 listings and found that higher-quality images made otherwise comparable items measurably more likely to sell — on the order of 1.25x for handbags and 1.17x for shoes — with the researchers noting image quality is one signal among several (view count mattered too). On returns, the NRF and Salsify figures above are both methodologically disclosed and traceable. And on buyer behavior, Baymard's finding that images are the first thing 56% of shoppers engage with is repeatedly reproduced in their UX research.
The honest takeaway is that imagery clearly influences conversion and returns, the effect size varies a lot by category and price point, and the only number that truly matters is the one your own test produces. Industry benchmarks tell you the lever is real; your data tells you how hard it pulls for your catalog.
Measurement Mistakes That Inflate (or Hide) Your ROI
Even sellers who measure often measure wrong. These are the errors that quietly corrupt photography ROI numbers in both directions.
- Changing multiple variables at once. New image plus new title plus new price equals an uninterpretable result. One variable per test, always.
- Calling tests early. Stopping the moment a variant pulls ahead manufactures false wins. Set the stopping rule before you launch and hold to it.
- Using revenue instead of margin. A 20% conversion lift on a low-margin SKU can still lose money once you net out cost of goods. ROI lives in margin.
- Ignoring the returns side. A flashy, over-saturated image can lift add-to-cart and quietly raise returns, netting out negative. Track both ends of the funnel.
- Testing on traffic that's too thin. Low-traffic listings rarely reach significance; forcing a verdict on a tiny sample is worse than admitting the result is directional.
- Forgetting the asset's lifespan. Comparing a one-time shoot cost against a single month of lift understates ROI; a good image earns for as long as the listing is live.
Avoid these six and your ROI numbers become something you can act on with confidence — pruning shoots that don't pay, and pouring budget into the listings where the data proves images move the needle.
Make Every Listing Earn Its Photography Budget
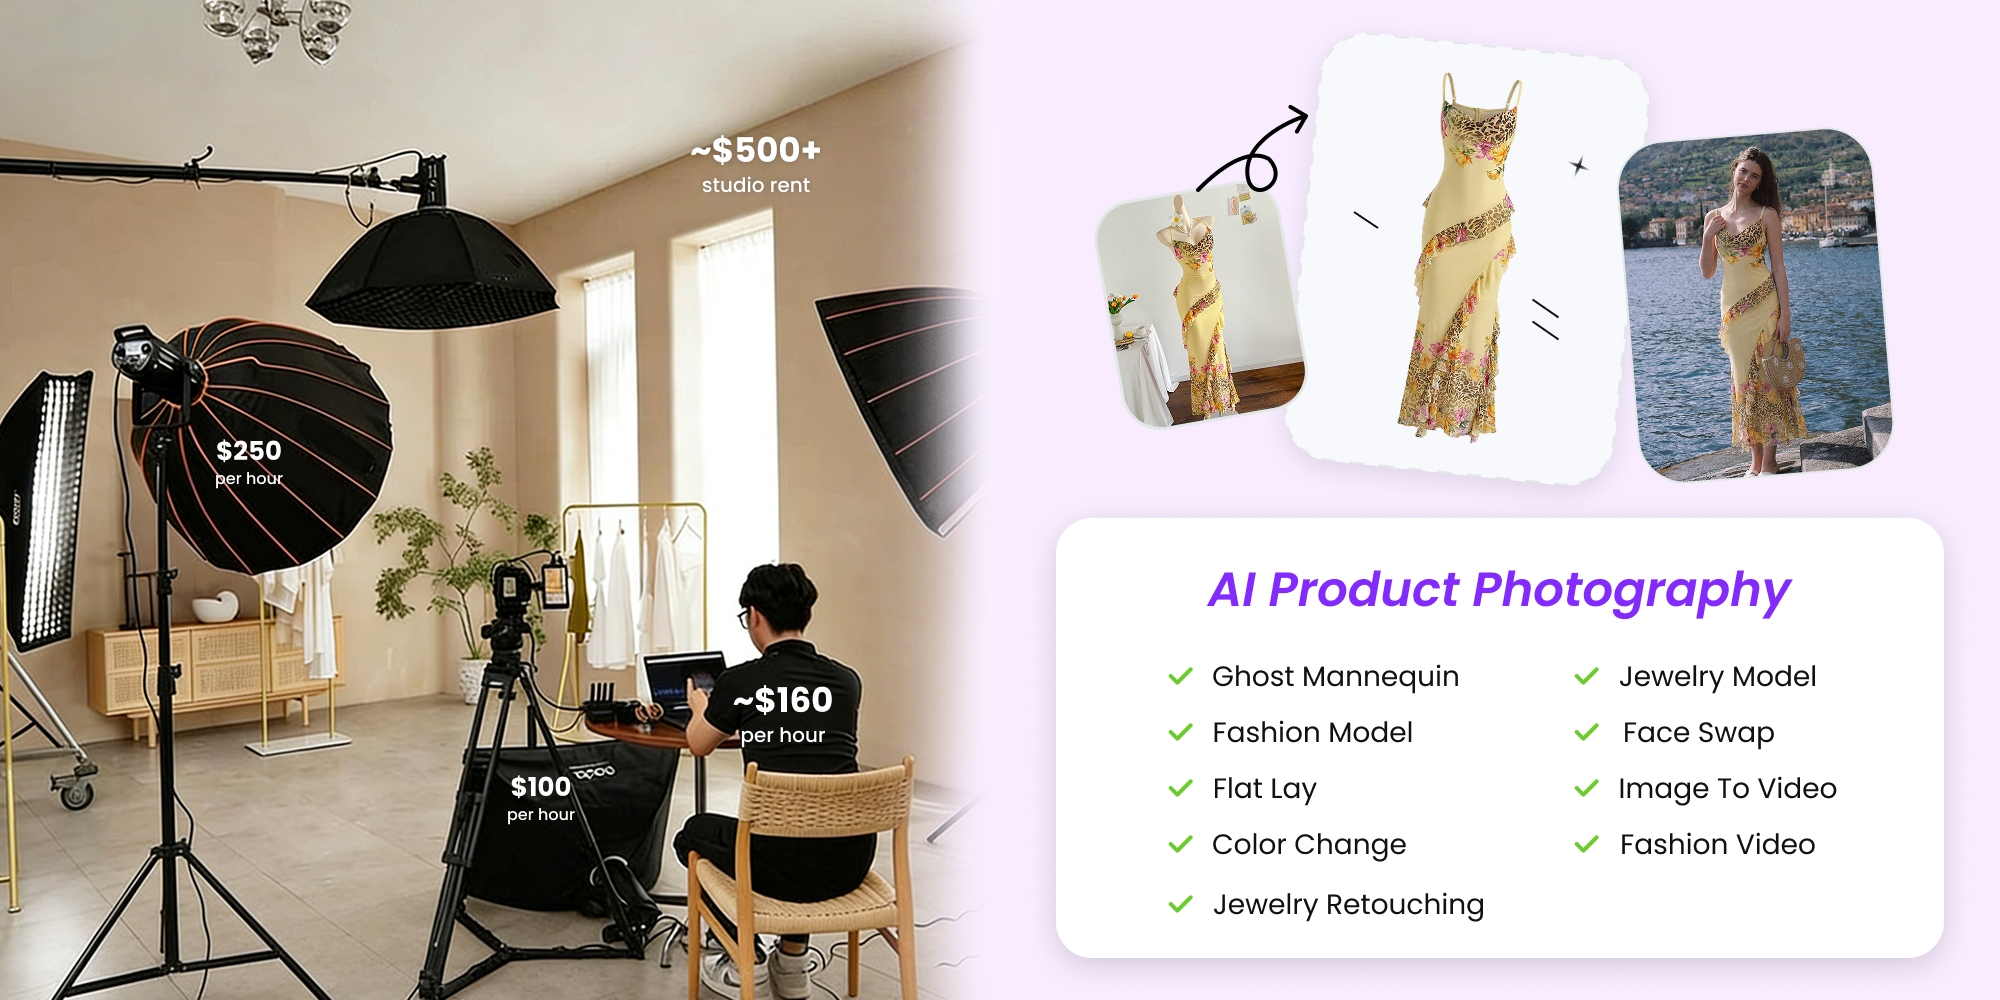
Measuring product photography ROI isn't about a single fancy dashboard — it's a habit: baseline, change one thing, test against split traffic, count both conversion lift and returns in margin terms, and let the payback math decide where the next dollar goes. The fastest way to make that loop affordable is to lower the cost of producing test variants in the first place. Snappyit turns one clean source photo into marketplace-ready packshots, lifestyle scenes, and on-model shots in minutes, so spinning up a new image to A/B test costs cents instead of a studio day.
Stop guessing whether your images are working, and start proving it.
More Resources on Product Photography
Frequently Asked Questions
What is the single best metric for measuring product photography ROI?
There isn't one metric that captures it alone, but per-SKU conversion rate is the headline number to start with, because images sit so early in the funnel. The complete picture pairs conversion lift with the change in return rate, both expressed in margin dollars rather than revenue. Conversion tells you images are winning more sales; return rate tells you whether those sales stick. ROI is only defensible when you account for both.
How do I A/B test product images on Amazon?
Brand Registry sellers can use Amazon's free Manage Your Experiments tool to split-test the main image. Amazon serves the two versions to roughly half your traffic each, runs the test for a window you choose in the four-to-ten-week range, and declares a winner once it reaches 95% statistical significance. You need a professional seller account enrolled in Brand Registry, A+ Content on the listing, and an existing title and image to be eligible. Test one element at a time so the result is attributable.
How long should an image A/B test run, and how much traffic do I need?
Decide your stopping rule before you start: either a fixed window (four to ten weeks is a reasonable default) or a pre-set significance threshold like 95% confidence. Because image changes usually produce single-digit-percent conversion swings, you need substantial volume to detect them — aim for at least several hundred conversions per variant on your own storefront, not just a few hundred sessions. Low-traffic listings may never reach significance, so use a longer before-and-after window and treat the result as directional.
How do I calculate the ROI of a product photo shoot?
Use this formula: ROI equals incremental margin from conversion lift, plus margin saved from fewer returns, minus the cost of the imagery, all divided by the cost of the imagery. Measure the conversion lift against a clean baseline or A/B test, convert it to incremental units and then to contribution margin, add any reverse-logistics savings from a lower return rate, and compare against the shoot cost. Because a good image keeps earning with no recurring spend, you can amortize the cost across the months the image stays live.
Can better product photos really reduce returns?
Yes, accurate imagery measurably reduces returns, though the exact effect varies by category. In Salsify's 2025 consumer research, 71% of shoppers said they had returned a product because it didn't match its online description, and the NRF and Happy Returns 2024 report put total US retail returns near $890 billion with online return rates above the overall average. Accurate color, in-scale reference shots, and multiple angles set expectations the delivered product can meet. When you compute the saving, work in absolute dollars of returned merchandise — cutting a return rate from 20% to 15% on $500,000 in revenue saves about $25,000, not $50,000.
Should I trust statistics like "better photos increase conversions by 40%"?
Be skeptical of any unattributed percentage. Many widely circulated photography statistics have no traceable study behind them and originate on vendor or marketing blogs. Credible figures do exist — a Cornell Tech analysis of roughly 75,000 marketplace listings found higher-quality images made items measurably more likely to sell, for example — but effect sizes vary widely by category and price point. The only number that reliably applies to your catalog is the one your own controlled test produces.